
 Product-level profitability in e-commerce is one area most founders don’t look at closely until cash starts feeling tight.On the surface, everything looks fine.Orders are flowing. SKUs are moving. Dashboards show growth.
Yet, when you check the bank balance, the numbers don’t feel right.That usually happens because not every product that sells is worth selling.Some products quietly generate cash. Others consume cash even while showing “good sales”.
This blog explains a practical, MIS-driven way to decide:
- which products deserve more focus and scale, and
- which products should be fixed, paused, or stopped.
No theory. Just clear checks you can apply immediately.
Why Product-Level Decisions Matter More Than Ever
Many E-commerce businesses review performance at:
- platform level (Amazon, Myntra, Website), or
- brand level (total revenue, total margin).
That’s useful — but incomplete.
Because cash leakage often sits inside individual products.
A single SKU with:
- high return rate,
- heavy discounting, or
- high fulfilment cost
can quietly cancel out the profit of two good-performing SKUs.
That’s why product-level profitability in e-commerce must be reviewed regularly — not once a year.
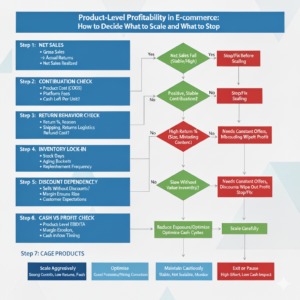
Step 1: Start with Net Sales, Not Gross Sales
Always begin at reality.
For each product, look at:
- Gross sales
- Less: discounts
- Less: actual returns
- Net sales realised
Many products look attractive at gross sales level. After returns and discounts, the picture changes completely.
Practical check: If net sales fall sharply after returns, scaling that product will stress cash — not improve it.
Step 2: Check Contribution After All Variable Costs
Next, calculate contribution per product after:
- product cost (COGS)
- platform commission
- payment gateway charges
- shipping and packaging
- return logistics
This step answers one question:
“After selling one unit, how much cash is actually left?”
Some products sell fast but leave almost nothing behind.
Decision rule:
- Positive, stable contribution → eligible for scale
- Thin or negative contribution → needs correction before growth
Step 3: Look at Return Behaviour Product-Wise
Returns are not a platform problem they are usually a product problem.
Track for each product:
- return percentage
- reason for return
- refund processing cost
You’ll often notice patterns:
- size issues
- quality mismatch
- misleading images
Practical insight: A high-return product locks cash twice — once during sale and again during refund.
Such products should never be scaled blindly.
Step 4: Measure Inventory Lock-In at Product Level
Some products consume cash simply by sitting in the warehouse.
Review:
- stock days per SKU
- ageing buckets (0–30, 31–60, 60+)
- repeat replenishment frequency
A slow-moving product with high stock value is a cash trap, even if margins look decent.
Decision rule: If inventory turns are slow and predictable demand is missing, reduce exposure or stop replenishment.
Step 5: Review Discount Dependency
Ask a simple question for each product:
“Does this product sell without discounts?”
If a product needs constant offers to move:
- margins erode
- returns rise
- customer expectations weaken
Practical check: Track contribution before and after discounts. If discounts wipe out profitability, scaling will only amplify losses.
Step 6: Compare Cash vs Profit at Product Level
Some products look profitable in reports but create cash stress.
Why?
- delayed settlements
- higher return cycles
- advance inventory purchases
Compare:
- product-level EBITDA
- product-level cash inflow timing
Insight: Products with slow cash recovery should be scaled carefully, even if margins look attractive.
Step 7: Categorise Products for Clear Action
Once MIS data is ready, categorise products into four buckets:
- Scale aggressively – strong contribution, low returns, fast cash
- Optimise – good potential but needs cost or pricing correction
- Maintain cautiously – stable but not scalable
- Exit or pause – high effort, low cash impact
This removes emotion from decisions and brings discipline into growth.
Conclusion
Growth in E-commerce doesn’t come from selling more products. It comes from selling the right products.
When you review product-level profitability in e-commerce regularly:
- cash flow becomes predictable
- inventory decisions improve
- marketing spend becomes sharper
As a Virtual CFO, I’ve seen businesses grow faster by stopping the wrong products than by launching new ones.
Clarity creates confidence. And confidence protects cash.


5 Comments. Leave new
79xcom? Hmm, I haven’t explored that one yet. But if it’s anything like the other ones, could be a decent time waster. Scope it out here: 79xcom.
Alright, 79xgame! Heard some chatter about this one. Is it legit? I’d be interested to check it out to see for myself. Jump in and test it out: 79xgame.
Trying to get into 79xlogin, eh? Hope you remembered your password! Seems straightforward enough. Here’s the portal: 79xlogin.
That’s a great point about balancing skill & chance in online games! It reminded me of JiliAce PH’s approach-they really blend tradition with tech. Considering a new platform? Check out jiliace ph app download apk – interesting concepts there!
It’s fascinating how easily we fall into patterns when gaming – seeking that next ‘win’! Platforms like jl59 games seem to tap into that, offering varied options like slots & tournaments. Understanding those psychological triggers is key to responsible play, right? 🤔